News Release
Equity, Bond, and Hybrid Mutual Funds Continue Two-Decade Trend of Declining Expense Ratios
ICI Reports for First Time on Exchange-Traded Funds’ Expense Ratios
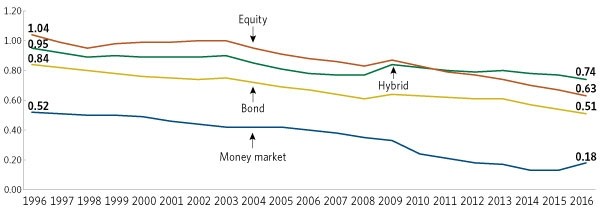
Washington, DC, May 17, 2017—The average expense ratios of long-term mutual funds declined in 2016, continuing a two-decade downward trend, the Investment Company Institute (ICI) reports in a new research study today. In 2016, investors paid, on average, 39 percent less for equity mutual fund expense ratios than in 1996—reflecting investor interest in lower-cost funds, industry competition, and economies of scale driven by asset growth, ICI says. A fund’s expense ratio is the fund’s total annual expenses expressed as a percentage of its net assets.
For the first time, the report, “Trends in the Expenses and Fees of Funds, 2016,” examines the expense ratios of exchange-traded funds (ETFs). They too show a downward trend, including a 32 percent decline in index equity ETF expense ratios from 2009 to 2016. Data for all figures in the report are accessible here.
Mutual Fund Expense Ratios Have Declined Substantially Since 1996
Percent, 1996–2016

Note: Expense ratios are measured as asset-weighted averages. Data exclude mutual funds available as investment choices in variable annuities and mutual funds that invest primarily in other mutual funds.
Source: Investment Company Institute, Lipper, and Morningstar
“Our research study finds a two-decade downward trajectory for expense ratios of actively managed and index mutual funds in a highly competitive market,” says Sean Collins, ICI’s senior director of industry and financial analysis. “In recent years, economies of scale and intense competition put downward pressure on fund expense ratios. The fund industry continues to meet investor demand for lower-cost investment options, such as through no-load share classes. Funds are adapting to a paradigm shift in the industry’s business model—a growing number of investors are paying their investment professionals for investment advice and assistance directly out of their pockets, rather than paying indirectly for advice through funds.”
The paper shows that the decline in average expense ratios in 2016 coincided with the Department of Labor’s fiduciary rulemaking, and was not caused by the rulemaking (see page 26 of the report).
Actively Managed and Index Mutual Fund Expense Ratios Continued to Decline
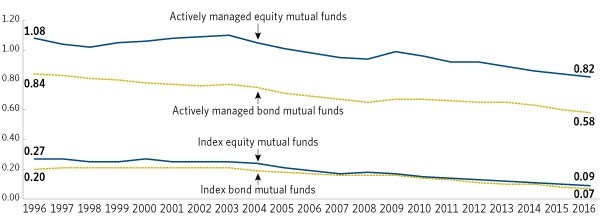
The report shows an overall decline in the average expense ratios of equity, bond, and hybrid mutual funds—a decline that also is present for actively managed and index equity and bond mutual funds. For example, over the two decades of actively managed and index mutual fund expense ratios plotted by the ICI report, the average expense ratio of actively managed equity mutual funds in 2016 was 24 percent less than in 1996 (see chart below).
In 2016, the average expense ratio of actively managed equity mutual funds fell to 0.82 percent, from 0.84 percent in 2015, while the actively managed bond mutual fund average expense ratio fell to 0.58 percent, from 0.60 percent. Over the same time period, the average index equity mutual fund expense ratio fell to 0.09 percent from 0.10 percent, and the average index bond mutual fund expense ratio fell to 0.07 percent from 0.08 percent.
Expense Ratios of Actively Managed and Index Mutual Funds
Percent, 1996–2016

Note: Expense ratios are measured as asset-weighted averages. Data exclude mutual funds available as investment choices in variable annuities and mutual funds that invest primarily in other mutual funds.
Sources: Investment Company Institute, Lipper, and Morningstar
Investors in target date mutual funds, which usually invest through a fund-of-funds structure, paid an average expense ratio of 0.51 percent in 2016, compared with 0.67 percent in 2008 (Figure 10 in the report).
ETF Expense Ratios Declined or Remained Unchanged in Recent Years
In 2016, the average expense ratio of index equity ETFs fell to 0.23 percent, down from 0.24 percent in 2015. Index equity ETF average expense ratios have fallen each year since 2009, when the average was 0.34 percent. This is largely attributable to competition and economies of scale within the ETF industry, which appear to have put downward pressure on index equity ETF expense ratios since then (Figure 16 in the report).
The average expense ratio of index bond ETFs was 0.20 percent in 2016, unchanged from 2015, and down from 0.25 percent in 2009. The market for bond ETFs has been maturing. Assets have increased significantly, and the number of funds and sponsors competing for investor dollars has grown. These developments have played a part in the recent decline of index bond ETF expense ratios.
ICI’s report also explains why index ETF average expense ratios are somewhat higher than those of index mutual funds, relating the composition of assets and relative size between the two products (see page 20 of the report).
Average Money Market Fund Expense Ratios Rose in 2016
Average money market fund expense ratios rose to 0.18 percent in 2016, from 0.13 percent in 2015, as fund sponsors reacted to rising short-term interest rates by reducing fund expense waivers. The Federal Reserve raised short-term interest rates in December 2015, enabling money market funds to reduce the amount of expenses they had waived to avoid negative yields—from $5.5 billion in 2015 to $2.5 billion in 2016 (Figure 6 in the report). This led to higher average expense ratios in 2016.
ICI Methodology
ICI evaluates fee trends using asset-weighted averages to summarize the expenses that shareholders actually pay through funds. To compute the average, ICI weights each fund’s expense ratio by that fund’s end-of-year assets. Simple averages (counting each fund’s expense ratio equally) overstate the impact of the expenses of funds in which investors hold few dollars.
