Frequently Asked Questions About the US ETF Market
How many Americans own ETFs?
How many US ETF providers are there?
How big is the US ETF market?
Where are assets of ETFs concentrated?
What are recent trends in demand for ETFs?
How many Americans own ETFs?
An estimated 15.2 million, or about 12 percent, of US households held ETFs in 2023. Of households that owned exchange-traded funds (ETFs), 84 percent also owned mutual funds.
How many US ETF providers are there?
As year-end 2023, 218 sponsors provided ETFs as an investment product.
How big is the US ETF market?
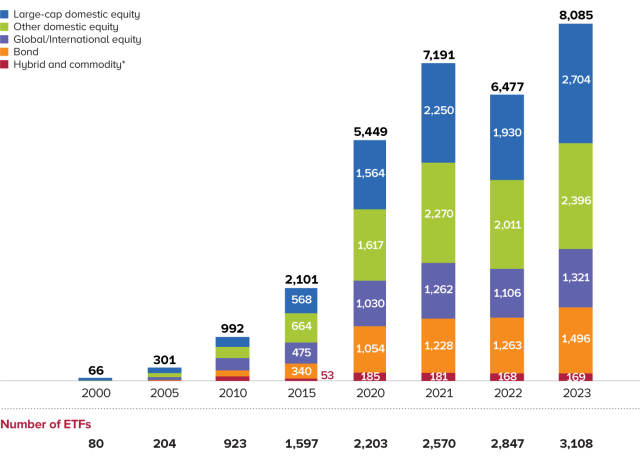
As of December 2023, the total number of index-based and actively managed ETFs, including commodity ETFs, domiciled in the United States stood at 3,108. Total net assets of these ETFs were $8.1 trillion and accounted for 24 percent of assets managed by investment companies at year-end 2023.
Where are assets of ETFs concentrated?
ETFs have been available for 30 years, and throughout that time, large-cap domestic equity ETFs have accounted for the largest proportion of ETF net assets. At year-end 2023, net assets in large-cap domestic equity ETFs totaled $2.7 trillion, or 33 percent of ETF net assets. Bond ETFs, which have been fueled by strong investor demand over the past several years, accounted for $1.5 trillion, or 18 percent, of net assets.
Total Net Assets and Number of ETFs Rose in 2023
Billions of dollars, year-end

1 Commodity ETFs include funds—both registered and not registered under the Investment Company Act of 1940—that invest primarily in commodities, currencies, and futures.
2 Data exclude bond, hybrid, and commodity ETFs.The first bond, hybrid, and commodity ETFs were opened in 2002, 2007, and 2004, respectively.
What are recent trends in demand for ETFs?
One way to track investor demand is to look at net issuance of ETF shares. Net issuance refers to the total dollar amount of shares issued/created by an ETF sponsor, less the total dollar amount of shares redeemed by the ETF sponsor. For more on how ETF shares are created and redeemed, see “Frequently Asked Questions About ETF Basics and Structure.”
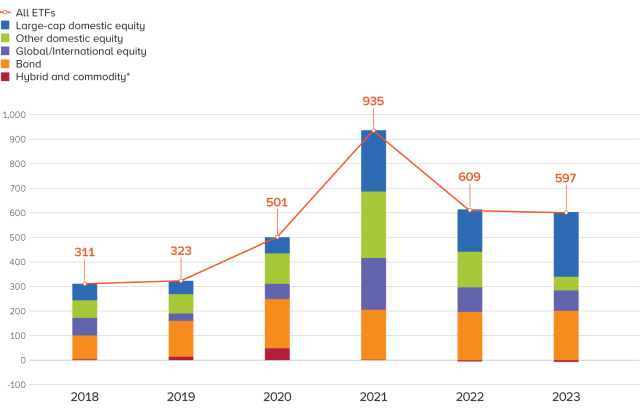
In recent years, demand for ETFs has grown as institutional investors have found ETFs to be a convenient vehicle for participating in, or hedging against, broad movements in the stock market and financial advisors are investing more of their retail clients’ assets in ETFs. Net share issuance of ETF shares (including reinvested dividends) was $597 billion in 2023 compared with $609 in 2022.
In 2023, demand for ETFs—though slightly down from 2022—remained strong. Net issuance of domestic equity ETFs was $319 billion in 2023, up from $317 billion in 2022, while net issuance of global/international equity ETFs fell from $100 billion to $83 billion. The higher demand for domestic equity ETFs likely reflected the stronger performance of US stocks in 2023 (26 percent[1]) compared with international stocks (13 percent[2]).
Despite gains of 6 percent (including interest income) on US bonds in 2023[3]—a sharp reversal from the losses of 12 percent in 2022—demand for bond ETFs remained fairly steady, with net issuance totaling $201 billion in 2023 versus $197 billion in 2022. In 2023, net issuance of bond ETFs was concentrated in intermediate-duration funds—an estimated 60 percent of the bond ETF net issuance went to funds with durations between 4 and 8 years.[4]
In recent years, some of the net share issuance represents mutual funds converting to ETFs. From the beginning of 2021 through 2023, 73 mutual funds, which held $96.3 billion in total net assets at the time of conversion, have converted to ETFs. These conversions represented only 4.5 percent of ETFs’ net issuance ($2.1 trillion) over the same period.
Net Share Issuance of ETFs Declined Slightly in 2023
Billions of dollars, annual

*Commodity ETFs include funds—both registered and not registered under the Investment Company Act of 1940—that invest primarily in commodities, currencies, and futures.
Note: Data for net share issuance include reinvested dividends.
Notes
[1] As measured by the Wilshire 5000 Index.
[2] As measured by the MSCI ACWI Ex USA Index (expressed in US dollars).
[3] As measured by the S&P US Aggregate Bond Index.
[4] Based on ICI calculations of data from Morningstar Direct.
May 2024

